 how-to
Solar Panel Performance Reports: Benefits & How to Use Them
Table of Contents
- What a Solar Panel Performance Report Contains
- How to Read a Solar Panel Monitoring App
- Understanding Your Solar Panel Energy Production Report
- Solar Panel Output Troubleshooting Using Reports
- Using a Solar Panel Maintenance Checklist with Performance Data
- Key Benefits of Regular Performance Monitoring
- How Cleaning and Maintenance Connect to Performance Reports
- Frequently Asked Questions
Last Updated: October 12, 2026
What a Solar Panel Performance Report Contains
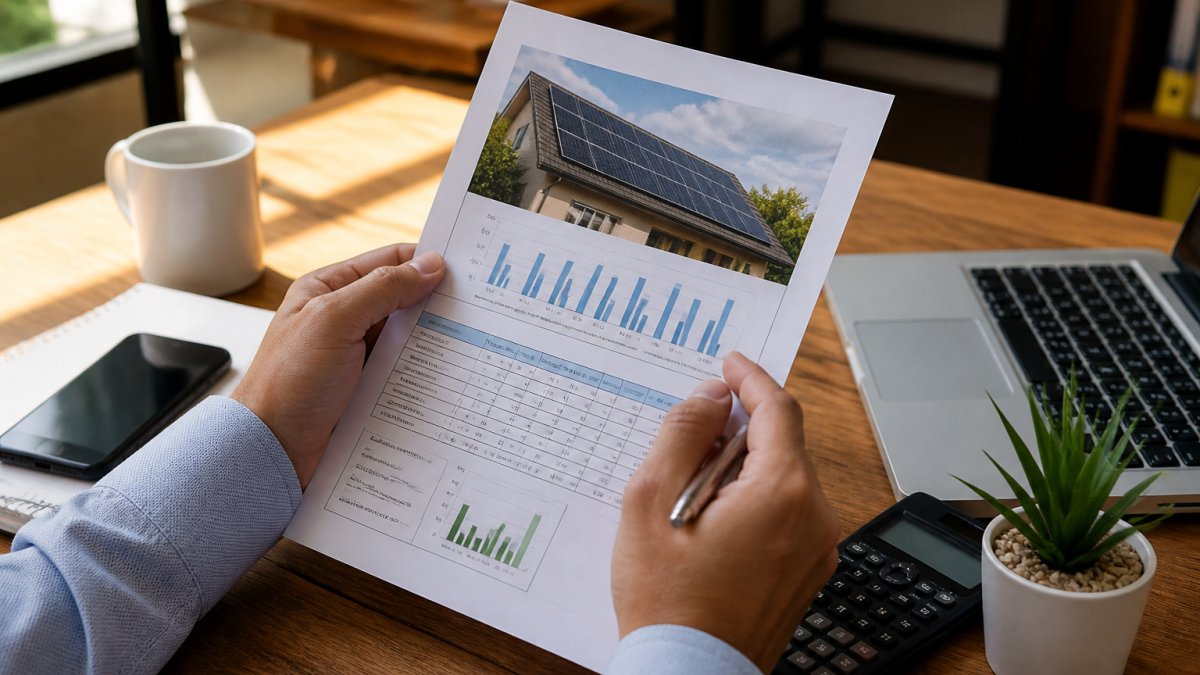
A solar panel performance report shows how well your solar system is working and how much electricity it produces, tracking output and flagging problems.
Most performance reports include these key elements:
- Daily and monthly energy production totals (measured in kilowatt-hours)
- Real-time power output data from your inverter
- System efficiency ratings compared to expected performance
The data comes from monitoring equipment installed with your system, which tracks every watt generated and sends it to a cloud-based dashboard.
How to Read a Solar Panel Monitoring App
Most monitoring apps report the same handful of metrics.
1. Current power (kW). The instantaneous reading at the top of the screen.
**2.
3. Actual vs. expected production. Your installer's proposal included an estimated annual production figure, usually from a tool such as NREL's PVWatts.
4. Performance ratio (PR). Actual production divided by what the system would have produced at rated capacity under the same sunlight.
**5.
Two more terms show up in utility-scale and commercial reports:
- Capacity factor, actual output divided by the output the system would have produced running at full rated power every hour of the period. Residential rooftop systems usually sit around 15-25%; utility-scale tracking arrays run higher.
- Weather-adjusted or irradiance-normalized production, production divided by the sunlight actually received, measured by an on-site pyranometer or pulled from a satellite irradiance dataset. This is the fairest way to judge a cloudy month.
Where the Data Comes From
Each metric is only as good as its source:
- Inverter or DC optimizers report production at the panel or string level, often every 5-15 minutes, the fastest data, and what lets an app show a single underperforming panel.
- Revenue-grade or utility meters measure what actually crossed the meter, updating monthly or in 15-minute intervals depending on the utility. These are the numbers your bill is based on; a few percent difference from inverter data is normal.
- Weather and irradiance data come from an on-site sensor, a nearby weather station, or a satellite service. Satellite data is cheap but an estimate, so a report built on it can be off by several percent on a partly cloudy day.
Reporting Cadence
Match the cadence to the question: daily views spot sudden outages, weekly and monthly views spot trends, and annual views judge whether the system meets your contract's production estimate. An app that refreshes once a day won't catch a short inverter outage, you'll just see a low day and assume clouds.
Understanding Your Solar Panel Energy Production Report
Your solar panel energy production report breaks down how much electricity your system generated over a specific period, the real financial impact of your investment.
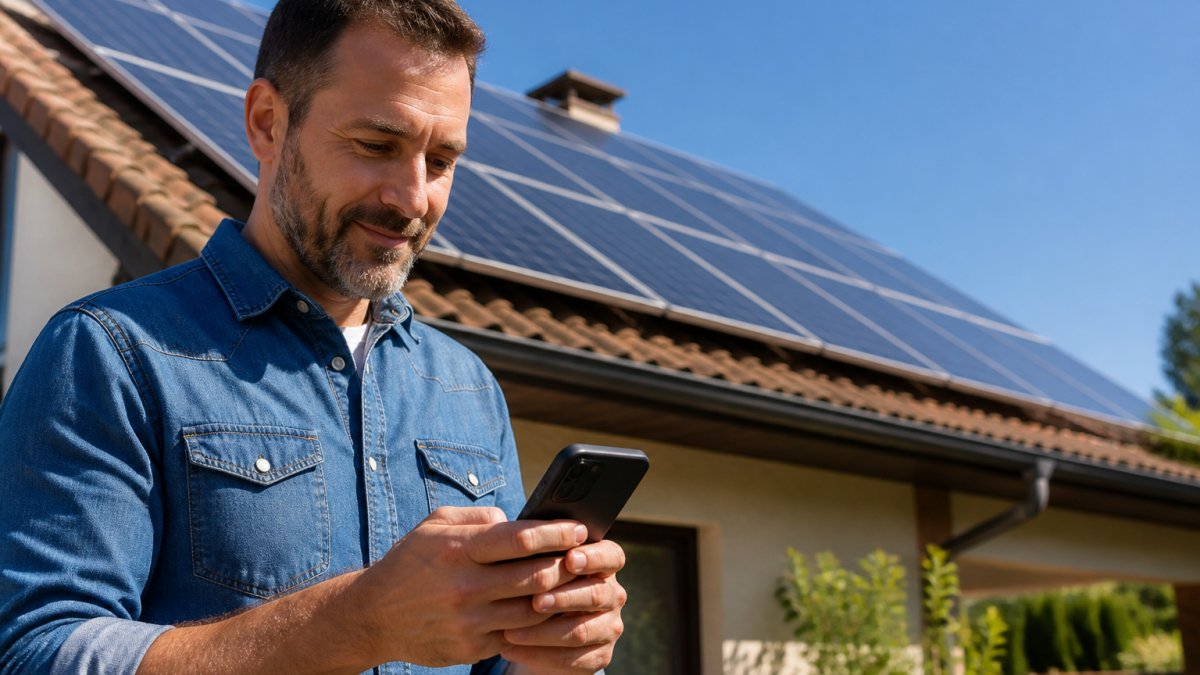
The report shows energy production in kilowatt-hours (kWh).
Compare actual production to the expected production in your report, which your installer calculated from system size, roof orientation, and local sun exposure.
Daily vs. Monthly Output Trends
Daily output shows how your system performed on a specific day. A good day is a smooth curve peaking around midday; a jagged or flat line suggests shading, clouds, or dirty panels.
Monthly output reveals seasonal patterns: most systems produce more in summer than winter due to longer days and higher sun angles. Winter output unusually low versus previous years is a red flag.
Efficiency Ratings and System Performance Metrics
Efficiency ratings measure how much available sunlight your panels convert to usable electricity. Panels typically operate at 15-22% efficiency.
Your report compares actual efficiency to rated efficiency. A system rated at 18% should produce close to that under ideal conditions; 12% on a clear day means your panels need attention.
System performance metrics also include temperature data, since panels work less efficiently in extreme heat.
Solar Panel Output Troubleshooting Using Reports
A performance report is a diagnostic tool, but only if you work through it in order, ruling out cheap, common causes before paying for a truck roll. Here is a workflow that moves from the whole system down to a single panel.
Step 1: Confirm the drop is real
First, check whether the low number is a production problem or a data problem. Monitoring platforms lose connection, gateways reboot, and Wi-Fi drops. A flat zero for several hours that then resumes is usually a communications gap, not a system failure. Cross-check the utility meter or inverter display: if the meter shows normal production while the app shows zero, the problem is the monitoring, not the panels.
Step 2: Normalize for weather
Compare the day in question to days with similar conditions, not your best day ever, and use the report's irradiance or weather-adjusted figure if it has one. A 40% drop on a heavily overcast day is expected; on a clear day it is not. This separates a real fault from ordinary weather variation, and it is the step most homeowners skip.
Step 3: Check the shape of the day, not just the total
A healthy day produces a smooth bell curve peaking around solar noon. The shape of the curve tells you what the total hides:
- A sharp dip at the same time every day, shading. A tree, chimney, power pole, or new construction is casting a shadow. Note the time; that tells you roughly where the obstruction is.
- A flat-topped or clipped curve, inverter clipping. The array is producing more DC power than the inverter can convert, so the top of the curve is cut off. This is normal and by design on many systems, not a fault.
- A curve that starts late or ends early, morning or afternoon shading, or a string that is offline.
Step 4: Compare panel to panel or string to string
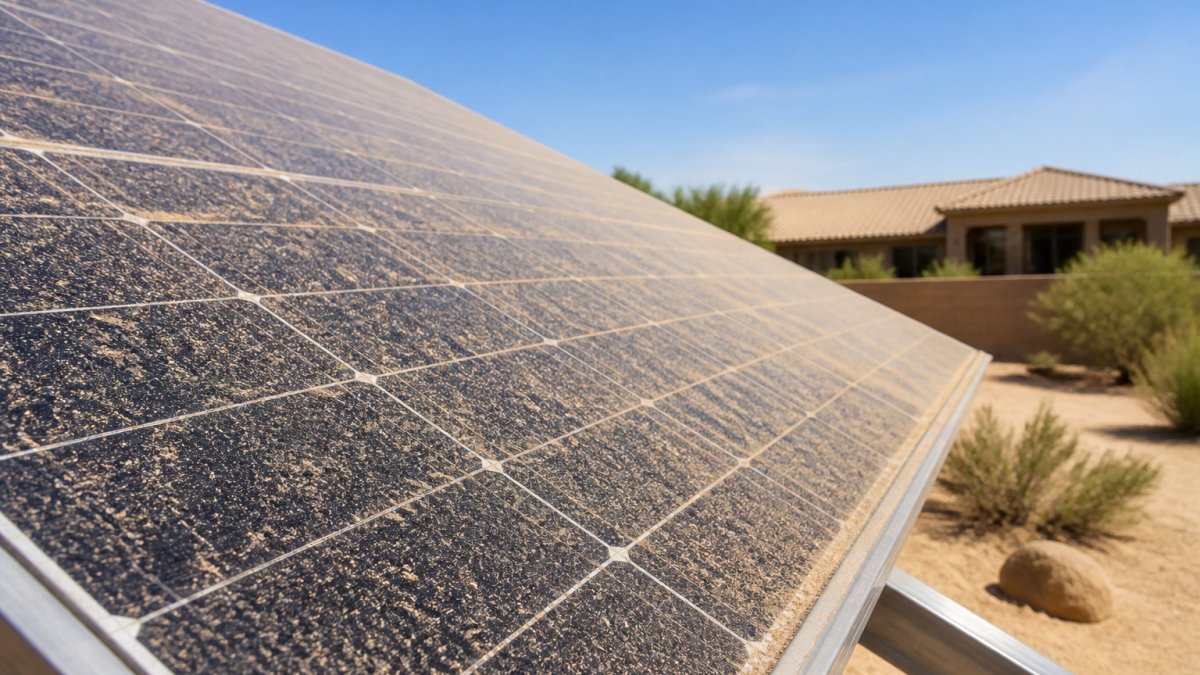
If your platform reports at the module or string level, sort by production and check the bottom performers. One panel 20% below its neighbors usually means localized soiling, bird droppings, a leaf pile, a nest, or a failed optimizer or bypass diode. A whole string underperforming points to a blown fuse, disconnected connector, or ground fault.
Step 5: Check the inverter and error log
The inverter is where most hard faults announce themselves. Pull the error log and look for ground faults, arc faults, grid-voltage faults, DC isolation faults, or overtemperature warnings. Many inverters derate when hot, showing up as a lower-than-expected afternoon plateau. An error code is a call to your installer, not a DIY fix.
Step 6: Compare year over year
Once weather, shading, and equipment faults are ruled out, compare the same month in prior years. Panels degrade slowly, manufacturers typically warrant around 0.5% loss per year after the first year, with an 80-92% output guarantee at year 25. A 1-2% year-over-year drop is normal aging; 10% or more in a single year supports a warranty claim.
Step 7: Decide on the action
| What the report shows | Likely cause | Action |
|---|---|---|
| Flat zero, then resumes | Monitoring or gateway outage | Check Wi-Fi and gateway; no panel work needed |
| Uniform drop, no weather explanation | Soiling | Clean the array, then re-check PR |
| Same-time daily dip | Shading | Trim vegetation or accept the loss; consult installer about microinverters or optimizers |
| One panel low, neighbors normal | Localized soiling or failed optimizer | Inspect that panel; call installer if hardware |
| Inverter error code | Equipment fault | Call installer; do not reset repeatedly |
| Steady multi-year decline beyond warranty rate | Degradation | Gather reports and file a warranty claim |
When to call a professional
Call your installer when the report shows an inverter error code, a ground or arc fault, a dead string while others produce, physical damage, or a year-over-year decline beyond the warranty rate. Bring the report, the actual vs. expected chart, the PR trend, and the error log. A documented pattern is far more persuasive than a call saying the system 'seems low,' and it turns a service visit into a warranty repair rather than a billable one.
Using a Solar Panel Maintenance Checklist with Performance Data
Combine your performance report with a maintenance checklist: the report tells you WHAT to fix, the checklist tells you HOW.
Start with a visual inspection, walk the roof or use binoculars to check for dirt, leaves, or bird droppings.
Finally, review your inverter display, the box that converts DC power from your panels to AC power for your home.
Key Benefits of Regular Performance Monitoring
Regular monitoring of your solar panel performance report protects your investment by catching problems early, before they cost thousands in lost production.
It also validates that your system delivers the savings you expected, consistent production means your investment is working, which matters for your peace of mind and your home's resale value.
And it gives you data to negotiate with your installer: if your system underperforms, your report proves it, so you can demand action backed by numbers rather than complaints.
Catching Efficiency Loss Before It Costs You
Efficiency loss compounds: a system losing 1% per month loses 12% per year, the difference between a $50 monthly bill reduction and $35, or thousands over 25 years.
Your performance report catches this loss immediately: when efficiency drops below baseline, you know cleaning or maintenance is needed. Catching it early means a single cleaning restores full performance; waiting means permanent damage and lower output.
Maximizing ROI and Energy Savings
Your ROI depends on consistent production. A clean system produces 25-30% more power than a dirty one, directly increasing your monthly savings.
Your solar panel performance report quantifies this: track monthly kWh production, multiply by your local electricity rate, and watch the savings grow after maintenance.
How Cleaning and Maintenance Connect to Performance Reports
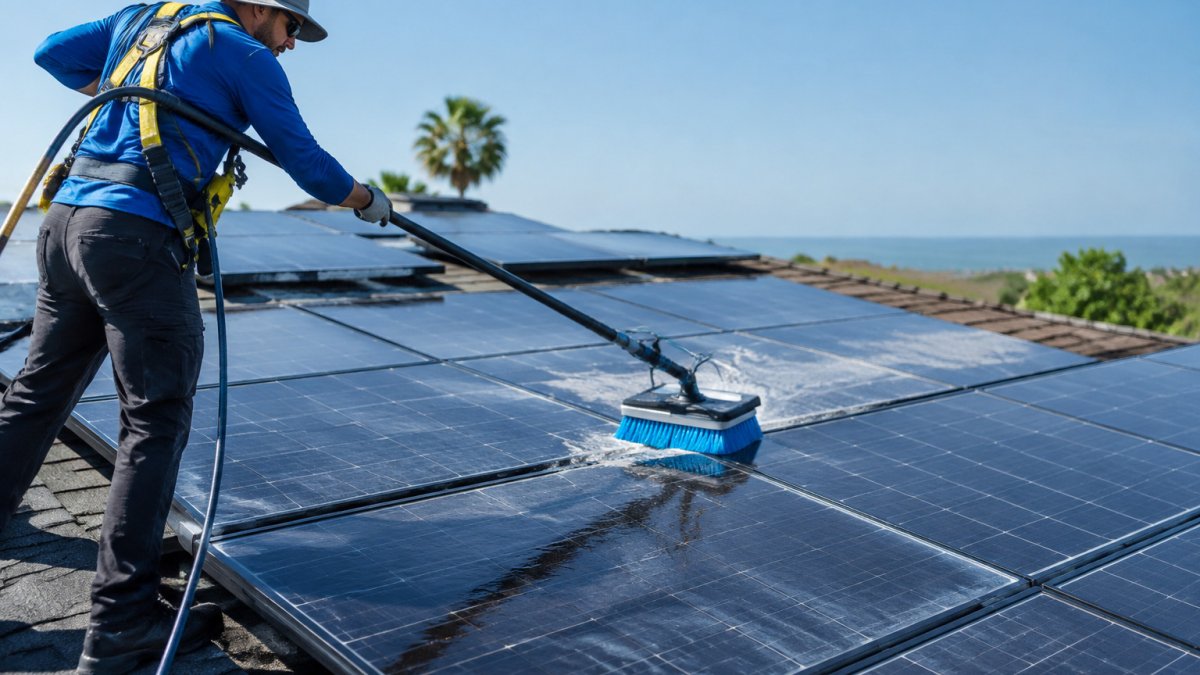
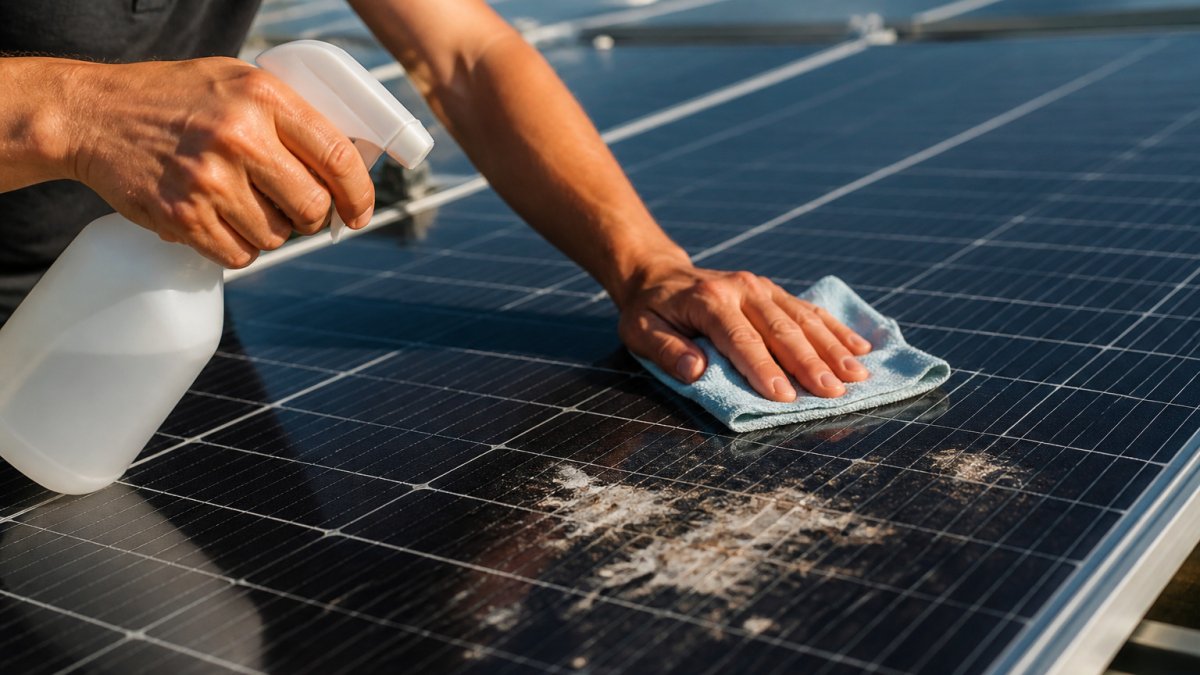
Cleaning is the single most effective maintenance action you can take.
Regular cleaning, typically quarterly, keeps your system at peak efficiency year-round, and your performance report becomes proof that cleaning delivers real results.
Understanding your solar panel performance report transforms you from a passive owner into an active manager of your investment.
At Mr Clean Solar Cleaning, we help homeowners and facility managers maximize the value of their solar investments.
Frequently Asked Questions
What should a solar panel performance report include?
A comprehensive solar panel performance report should show daily and monthly energy production in kilowatt-hours, system efficiency rating as a percentage, real-time power output, weather conditions during measurement periods, and comparison of actual output versus expected output based on system size and sunlight. Reports should also flag any performance anomalies or efficiency drops that warrant investigation or maintenance.
How do I know if my solar panels are performing properly using a performance report?
Compare your actual energy production to the expected output calculated for your system size, panel orientation, and local solar radiation. Most monitoring apps display this comparison directly. If actual output consistently falls 10-15% or more below expected output, investigate potential causes: shading, dust accumulation, bird droppings, temperature extremes, or equipment faults. Professional cleaning often restores efficiency when buildup is the culprit.
Can a performance report show whether my solar panels need cleaning?
Yes. A sudden drop in energy production without corresponding changes in weather or system configuration often indicates dirt, dust, or bird droppings blocking sunlight. Performance reports that show efficiency decline over weeks or months suggest accumulation. If output rebounds sharply after cleaning, the report confirms that maintenance restored your system. This data justifies the investment in professional cleaning services.
How often should I review my solar panel performance report?
Review your solar panel monitoring app weekly to catch sudden drops in output, and conduct a detailed monthly analysis comparing production trends. Seasonal reviews help you understand how weather patterns affect your system. If you notice consistent underperformance, investigate immediately. Regular monitoring helps you catch cleaning needs, equipment failures, or efficiency losses before they significantly impact your energy savings or ROI.